Blog
By
Nelson Uzenabor

A founder opens the CRM dashboard after a busy week and sees plenty of activity: pipeline value, email opens, contact totals, and several colorful charts. Yet one question remains unanswered: who needs attention today, and what should happen next?
That gap explains why many analytics projects disappoint. The CRM contains customer records, sales activity, service conversations, and product signals, but the team still relies on spreadsheets, memory, or intuition to prioritize work. Analytics in CRM becomes valuable when it changes a decision, assigns an owner, and produces a measurable next action.
The market's direction reflects this shift. One industry estimate values the CRM analytics market at USD 9.13 billion in 2024 and projects USD 18.14 billion by 2030, while another study estimates USD 12.11 billion in 2026 and projects USD 20.65 billion by 2031 (TechSci Research CRM analytics market data). The important point isn't which estimate you prefer. Businesses increasingly expect CRM systems to help them forecast, prioritize, retain, and grow customers, not merely store records.
Table of Contents
The Moment a CRM Dashboard Stops Being Useful
A dashboard stops being useful when it shows activity without clarifying responsibility. Total contacts, cumulative opportunities, and email engagement may describe the business, but they don't tell a sales manager which deal deserves a call or tell a support leader which account is close to escalation.
Start with the decision, not the chart. Ask what the team must decide during its daily or weekly operating rhythm:
Lead priority: Which prospects show enough fit and engagement to receive immediate attention?
Pipeline health: Which opportunities have stalled, lack a next step, or depend on an unrealistic close date?
Renewal risk: Which customers show declining engagement, unresolved service issues, or weakening product usage?
Expansion potential: Which accounts have asked about adjacent capabilities or reached a usage pattern that suggests a broader need?
Service intervention: Which conversations require escalation, a specialist, or a proactive recovery call?
Each question needs a defined workflow. A decline in response performance might send a staffing issue to the service manager. A product-usage warning might create a customer-success task. A high-priority lead might be routed to a named representative with a response expectation and a required disposition.
Design the action before the metric
For every KPI, document five things:
Definition: How is the value calculated?
Scope: Which customers, teams, stages, or time period does it cover?
Threshold: What change counts as a meaningful warning?
Owner: Who must respond?
Cadence: When will someone review the signal?
A useful dashboard should help a person answer three questions quickly: What changed? What does it mean? What will I do now?
Practical rule: If nobody owns the next action, the metric is descriptive information, not an operating control.
Establish a baseline before adding artificial intelligence or predictive scoring. Without a trustworthy starting point, the team can't tell whether a new recommendation improved prioritization, shortened response time, or changed commercial outcomes. The objective is not to collect more indicators. It's to build a repeatable system that observes customer behavior, directs work, records the response, and learns from the result.
What Analytics in CRM Really Means
CRM analytics combines customer, sales, service, and product information to evaluate performance, explain outcomes, forecast behavior, and recommend or automate action. The distinction matters because a CRM report can be accurate and still have little operational value.
A practical model has four layers:
Descriptive analytics answers what happened. It reports pipeline creation, ticket volume, renewal activity, or customer churn.
Diagnostic analytics asks why it happened. It connects an outcome to contributing conditions, such as low product engagement, a new integration problem, or slow resolution.
Predictive analytics estimates what may happen next. It can support renewal-risk assessment, lead prioritization, or expansion targeting.
Prescriptive analytics recommends what someone should do. It may suggest a call, a service escalation, a targeted message, or a change in routing.
Consider a SaaS support team. Descriptive analytics might show that ticket volume and resolution time increased. Diagnostic analysis could connect the change to a recently released integration. Predictive analysis might identify accounts likely to downgrade after repeated unresolved conversations. Prescriptive guidance could recommend assigning a specialist, creating a product-feedback record, or scheduling a customer-success conversation.
Every layer depends on the one below it
A predictive model can't compensate for inconsistent source data. A recommendation engine can't create value if the team has nowhere to receive the recommendation or no agreed process for acting on it.
The system therefore needs more than software features:
Reliable inputs: Customer identity, account ownership, opportunity stage, service history, and product events must connect correctly.
Business definitions: Teams must agree on what counts as a qualified lead, an active opportunity, a resolved case, or an at-risk account.
Decision pathways: The CRM must create a task, alert, assignment, or guided action that fits the user's existing workflow.
Outcome capture: The team must record whether the action occurred and what happened afterward.
This is why analytics in CRM is better understood as an action system. Reports describe the past. A mature system uses that history to improve prioritization, communication, and service delivery.
The Metrics and KPIs That Actually Move the Needle
The right KPI makes a controllable business question visible. The wrong one creates a polished summary that nobody can use.
Sales teams usually need metrics that connect lead quality to opportunity movement. Useful examples include qualified-lead conversion rate, pipeline coverage, average sales-cycle length, win rate, and revenue per opportunity. Together, these help leaders distinguish a lead-generation problem from a qualification problem, a forecast problem, or an execution problem. For readers who need a clear foundation, this pipeline sales definition provides useful context for understanding how opportunities move through a sales process.
Service teams need both speed and resolution quality. Average first-response time, resolution time, reopen rate, customer satisfaction, and support cost per customer can show whether faster handling also solves the underlying issue. A low response time may look positive while customers continue reopening cases, so the metrics should be reviewed together. For a deeper operating view, compare these measures with the guidance in customer service analytics.
Adoption and customer-behavior metrics complete the picture. Track active CRM users, feature utilization, onboarding completion, product-engagement trends, renewal risk, expansion revenue, and churn by segment. The useful segment depends on the business. A SaaS company might group accounts by lifecycle stage and product behavior, while an e-commerce company might connect repeat purchases, average order value, customer lifetime value, and campaign-assisted revenue.
Metric Group | Example KPIs | What They Reveal | Likely Action |
|---|---|---|---|
Sales | Qualified-lead conversion, win rate, sales-cycle length | Lead quality, selling efficiency, forecast confidence | Adjust qualification, coaching, routing, or deal review |
Service | First response, resolution time, reopen rate, CSAT | Handling bottlenecks and unresolved customer pain | Improve staffing, escalation, knowledge, or product feedback |
Adoption | Active usage, onboarding completion, engagement trend | Whether customers are reaching value | Trigger education, success outreach, or risk review |
Commercial | Expansion revenue, churn by segment, revenue per opportunity | Where retention and growth are concentrated | Prioritize accounts, offers, and resource allocation |
Remove metrics that don't change behavior
Total contacts, raw email opens, cumulative deals created, and dashboard totals without a denominator or trend often function as vanity metrics. A contact count doesn't show who is marketable, and a large pipeline can conceal weak conversion or stale opportunities.
Every headline KPI should have a calculation, period, segment, target, data owner, and linked action. Pair leading indicators, such as onboarding progress, with lagging outcomes, such as renewal and revenue. That pairing helps the team avoid optimizing activity while missing the customer or financial result the activity was meant to produce.
From Descriptive to Prescriptive Analytics
A CRM analytics program usually matures in a sequence, but teams often try to skip ahead. They buy predictive scoring before defining opportunity stages, cleaning contact records, or deciding what a sales representative should do with a score.
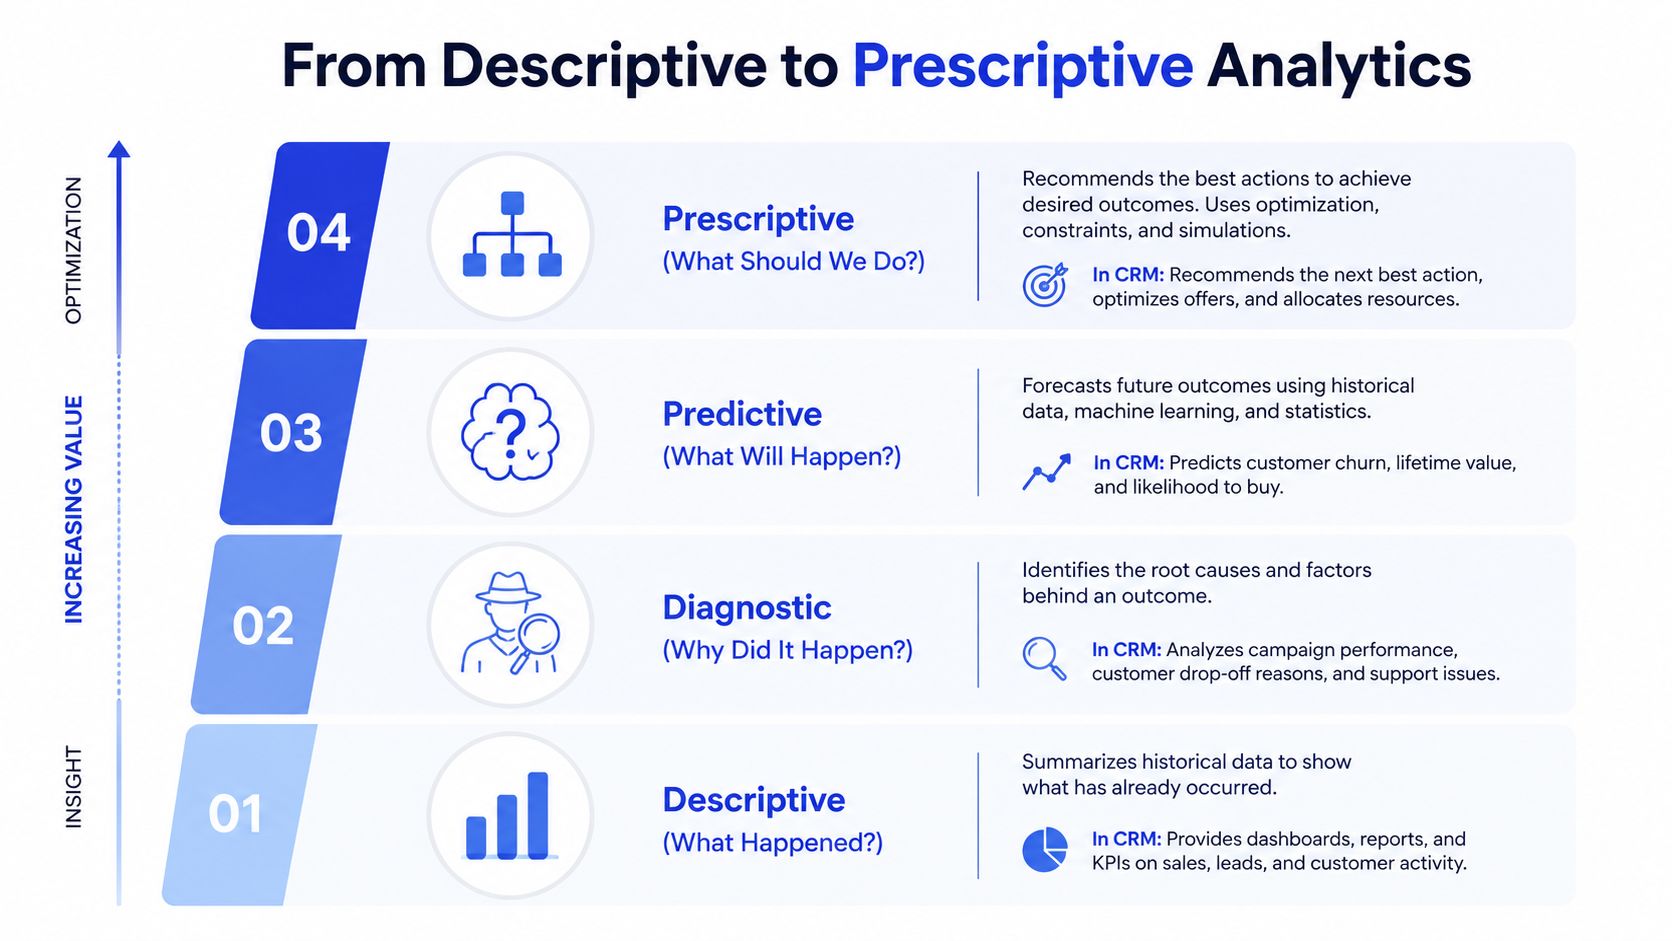
Descriptive reporting might show that a channel produced many leads. Diagnostic analysis examines whether those leads matched the target customer profile, engaged with key content, or progressed through the funnel. Predictive analysis then uses historical wins and losses alongside firmographic, behavioral, and engagement signals to estimate which prospects resemble successful opportunities. Prescriptive analytics converts that estimate into a next step, such as assigning a call, sending an email, or requesting qualification.
Treat data readiness as a gate
Predictive scoring isn't automatically reliable because a vendor calls it artificial intelligence. The model needs consistent historical outcomes and complete fields. Independent guidance identifies critical-field completeness below 70% as a practical stop-signal, because missing core attributes can weaken score reliability and routing decisions (predictive analytics CRM guidance from Prospeo).
Before activating a score, inspect:
Outcome history: Are won, lost, disqualified, and open opportunities recorded consistently?
Identity quality: Are duplicate contacts and accounts removed or linked?
Stage definitions: Does each stage represent a stable customer milestone?
Signal coverage: Do records contain the firmographic, behavioral, and engagement fields the model needs?
Workflow ownership: Does someone review and disposition high-priority records?
Suppose the model ranks a prospect highly. The workflow should specify who receives the record, which context appears in the task, how quickly the person follows up, and what happens when the prospect isn't ready. The team should also record whether the score was helpful, not merely whether the lead was contacted.
For retention use cases, a practical churn prediction guide can help teams think through warning signals and intervention design. The same principle applies to lead scoring: a prediction has value only when the organization can take a relevant action and learn from its result.
Why Most CRM Analytics Projects Stall
The hardest part of CRM analytics is rarely the model. It's the plumbing and the behavior around it.
Integration architecture is described as a major barrier to CRM analytics success in recent coverage, which also projects that more than 50% of enterprises may remain behind in AI deployment through 2027 because of outdated data processes and integration architectures (Ainformat coverage of CRM analytics integration challenges). The specific lesson for a smaller business is practical: advanced features can't repair broken data movement.
What breaks underneath the dashboard
Duplicate records inflate pipeline counts and split interaction histories. A failed synchronization can leave a webform lead outside the routing workflow. Missing field-level permissions can create silent gaps, while conflicting refresh schedules can make a dashboard look current even though its source data is stale.
The frontline often exposes the problem first. If representatives log activities in spreadsheets, agents keep separate notes, or managers export reports for every review, the CRM no longer captures the behavior the analytics system needs. The dashboard may remain technically available, but users stop trusting it because it contradicts what they see in daily work.
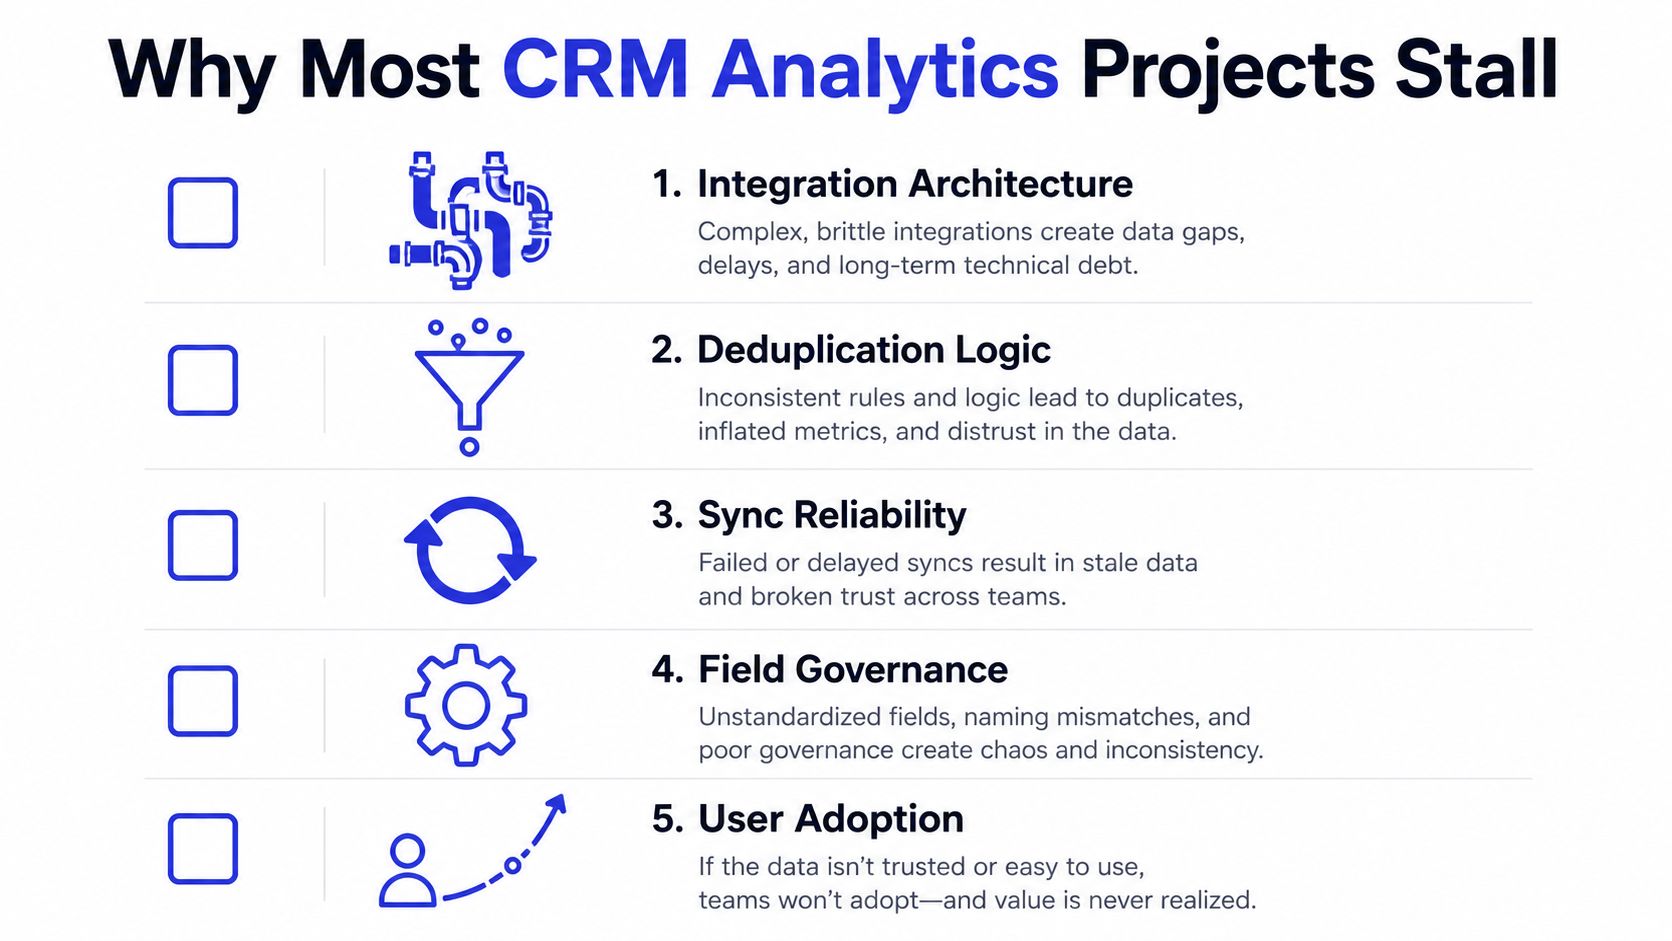
Five controls deserve attention before model selection:
Integration architecture: Map how CRM, helpdesk, billing, marketing, and product systems exchange records.
Deduplication logic: Define the identity rules that determine whether two records represent one customer.
Sync reliability: Monitor failed transfers, delayed updates, partial writes, and API-limit conflicts.
Field governance: Specify required fields, permitted values, ownership, and change approval.
User adoption: Measure whether each role records the activities and outcomes required by its workflow.
Analytics can't be more trustworthy than the process that creates its data.
The adoption gap is also organizational. Academic work on customer analytics use identifies customer orientation and analytics culture as important drivers of information quality and CRM performance (Ainformat coverage of customer analytics use). Leaders must therefore assign owners to metrics, place insights inside existing work queues, and review outcomes with the people expected to act.
Building a CRM Analytics Stack for SMBs and SaaS Teams
An SMB doesn't need an oversized architecture on the first day. It needs a connected, governed path from customer record to frontline action.
The bottom layer is the CRM of record, such as HubSpot, Salesforce, or Zoho. This layer should contain consistent lifecycle stages, account ownership, required fields, and a clear rule for where customer identity is maintained. If the CRM can't answer who owns the account or where an opportunity stands, analytics will only make the uncertainty more visible.
The middle layer handles integration and analysis. A lightweight connector may be enough at first. A growing SaaS company may add Segment, BigQuery, Looker, Metabase, or Power BI as event volume and reporting needs expand. Reverse ETL then sends useful scores, segments, and product signals back into the CRM, so representatives don't need to open a separate analytics environment to act.
The top layer is activation. An AI support agent can capture conversation transcripts, customer intent, qualification details, escalation behavior, and resolution outcomes. Those signals can become CRM properties or events that support lead routing, service analysis, and account reviews. Chatgrow is one option in this layer, providing custom support agents that can answer questions, qualify leads, and report on conversation and escalation behavior. Teams considering architecture should also review these customer data integration practices.
Build the first dashboards around decisions
Start with three views:
Pipeline coverage: Shows opportunity quality, stage movement, stalled records, and ownership.
Retention and churn risk: Combines renewal timing, service history, engagement, and product behavior.
Support-to-product feedback: Connects recurring intents, escalations, resolution outcomes, and product issues.
The essential integrations are CRM to helpdesk, CRM to billing, and CRM to product analytics. Marketing data also needs a governed path into the customer record. This guide to marketing and CRM integration steps offers useful implementation context for mapping that relationship.
Layer | Purpose | Example Tools |
|---|---|---|
CRM of record | Store governed customer, account, opportunity, and service context | HubSpot, Salesforce, Zoho |
Integration and BI | Combine operational records and product events for analysis | Segment, BigQuery, Looker, Metabase, Power BI |
Activation | Put scores, tasks, segments, and conversation outcomes into daily workflows | CRM automation, reverse ETL, AI support agents |
Keep the stack modest until users trust the definitions and act on the outputs. More tools add more mappings, permissions, refresh paths, and failure points.
Measuring ROI From CRM Analytics
Report volume isn't return on investment. A team can create many dashboards without changing how representatives qualify leads, how agents resolve cases, or how managers allocate attention.
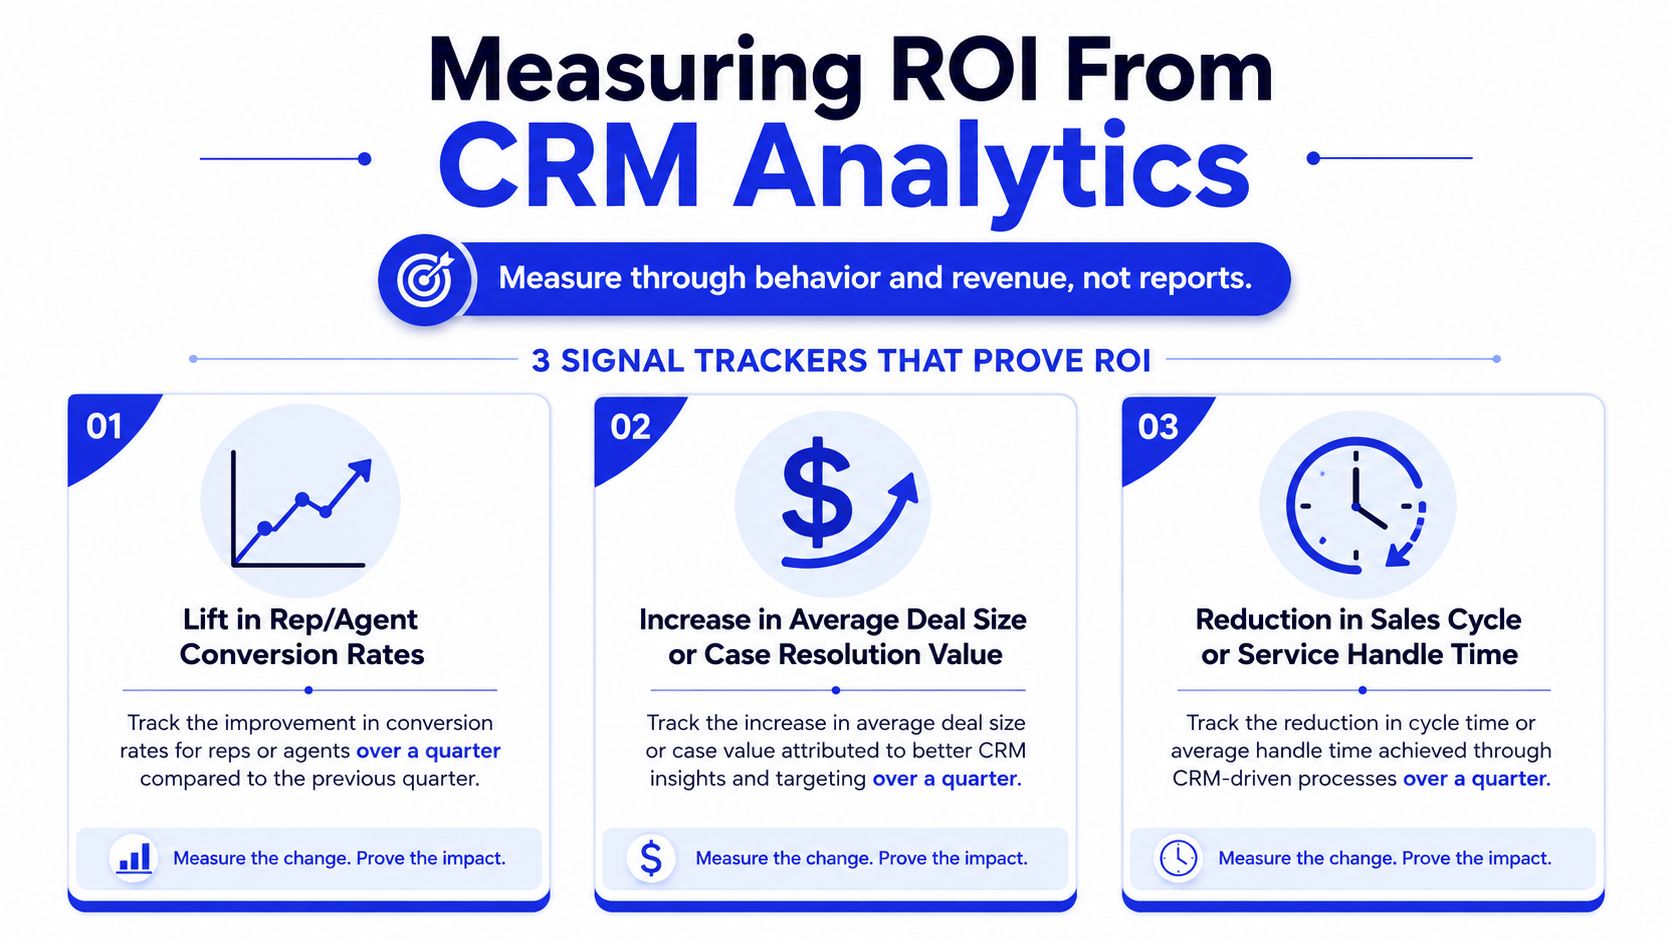
A stronger ROI framework follows the chain from insight to behavior to outcome. Review three signals over a defined operating period:
Conversion behavior: Compare the conversion performance of representatives or agents using a specific recommendation workflow with the established baseline.
Time to action: Track how quickly teams respond to scored leads, renewal warnings, and support escalations.
Commercial or retention result: Connect analytics-assisted activity to pipeline movement, retained revenue, expansion, or resolved customer value.
Use a simple measurement loop
Before launching a model or dashboard, record the current process. How do people prioritize leads today? How long do cases wait for a response? Which signals prompt an account review? Then introduce one analytics intervention and track whether the expected behavior occurs.
Review the evidence with both revenue and service leaders. If a scored lead receives no follow-up, the issue may be routing, trust, workload, or unclear guidance. If an agent sees a recommendation but keeps using a separate knowledge source, simplify the workflow before adding another model. Low adoption is an early ROI warning, not a reason to buy more software.
The link between analytics and performance should remain visible:
Signal: A customer or opportunity meets a defined condition.
Recommendation: The CRM suggests a specific next action.
Behavior: A named person accepts, changes, or rejects the recommendation.
Outcome: The team records the commercial or customer result.
Learning: Leaders adjust the rule, workflow, or data source.
For service leaders, customer service reporting provides a useful reference point for connecting operational reporting to decisions. The same discipline applies across the CRM. Measure what changed in the work, not how many charts were published.
A 30-60-90 Day Plan and Quick Answers
A practical rollout starts with reliability and ends with automation.
Days 1 to 30
Audit CRM fields, stage definitions, duplicate records, account ownership, and permissions. Map the connections to billing, support, marketing, product analytics, and any AI agent. Select a small set of business questions and assign an owner to each one.
Days 31 to 60
Launch dashboards for pipeline health, retention risk, and adoption or support feedback. Validate one predictive lead-scoring use case against historical opportunity outcomes, then show representatives how the score changes their qualification workflow. Don't automate routing until users can explain what the score means and what action follows it.
Days 61 to 90
Add prescriptive recommendations, such as next-best-action tasks, escalation rules, or renewal-review prompts. Review adoption, time to action, and commercial or service outcomes with team leaders. Remove signals that create noise, improve the fields that users skip, and document the definitions that now govern the system.
Quick answers for founders and marketing leads
How much CRM data is enough? Enough means data that is complete, consistent, and tied to known outcomes. Volume alone doesn't make a model trustworthy.
When does predictive analytics become reliable? It becomes more defensible when the CRM contains clean historical outcomes, deduplicated identities, stable stage definitions, and sufficient critical-field completeness. If critical fields fall below 70% completeness, independent guidance treats that as a practical warning to stop and repair the data first (Prospeo predictive CRM guidance).
Does an SMB need a dedicated data team? Not necessarily. It does need a named owner for definitions, integrations, access, and adoption, even if those responsibilities are shared across operations and revenue leadership.
How can an AI support agent contribute? It can turn conversations into structured intent, qualification, escalation, and resolution signals, provided those events flow into the CRM and the team uses them in a defined workflow.
Which dashboards should come first? Start with pipeline health, retention risk, and support or adoption feedback. Each should answer a decision question and create a clear next action.
Chatgrow helps businesses deploy custom AI customer-service agents that answer questions, qualify leads, capture conversation signals, and support reporting across customer interactions. Visit Chatgrow to connect frontline conversations with the CRM workflows and analytics your team is ready to act on.
More articles from the chatgrow Team