Blog
By
Nelson Uzenabor

Most advice about customer engagement metrics starts with a list. Track open rate, NPS, session duration, and churn, then put them on a dashboard. That approach feels rigorous, but it often produces a polished view of activity without answering the question executives care about: which customer interactions increase conversion, retention, or expansion?
Engagement isn't a single number. It combines what customers do, how they feel, and whether they progress toward a valuable outcome. The useful measurement system connects those layers across your website, product, support conversations, and campaigns, then shows where interest strengthens, stalls, or disappears.
Table of Contents
Why Traditional Customer Engagement Metrics Fail Modern Businesses
A high open rate can coexist with weak pipeline. A busy support inbox can conceal unresolved friction. A product dashboard can show frequent logins while customers avoid the feature that creates lasting value. These aren't rare measurement errors. They happen when teams treat channel activity as the outcome instead of as evidence that needs context.
Industry coverage identifies a substantial integration gap: 63% of brands measure channels in isolation, while only 21% connect engagement data well enough to act on it (Emarsys' analysis of customer engagement metrics). The result is predictable. Marketing reports attention, product reports usage, support reports tickets, and finance sees the consequences later in conversion, renewal, or churn.
Practical rule: A metric matters only when someone can identify the customer decision it should change.
Vanity metrics hide timing and intent
Absolute counts are particularly dangerous. More sessions may mean stronger interest, or they may mean users are struggling to find an answer. More tickets may indicate healthy channel adoption, or repeated failures in self-service. Even email opens sit early in the journey. They show exposure and attention, not necessarily meaningful action.
A better model follows the customer path from first visit to repeat use. It compares engagement across web, product, support, and email touchpoints, then connects changes in those signals to later outcomes. The established shift from survey-only measurement toward multi-channel behavioral analytics reflects this need. Common measures now include feature usage, visit frequency, time spent, NPS, CSAT, activation, retention, churn, conversion rate, pages per session, and average session duration (Sogolytics' customer engagement survey framework).
Disconnected dashboards miss early risk
A customer might visit a pricing page, start a support conversation, adopt a core feature, and then stop progressing. If those events live in separate tools, no team sees the complete pattern. By the time churn appears in a billing report, the preventable signals have already passed through the system unnoticed.
The fix isn't to collect every possible event. It's to assign each metric a role. Behavioral measures show activity, sentiment measures reveal experience quality, and outcome measures confirm whether engagement produced commercial value. Without that structure, teams optimize the easiest number to move, not the customer journey that drives revenue.
For the technical foundation, a customer data integration approach can help unify identities, events, and conversations before teams attempt complex attribution.
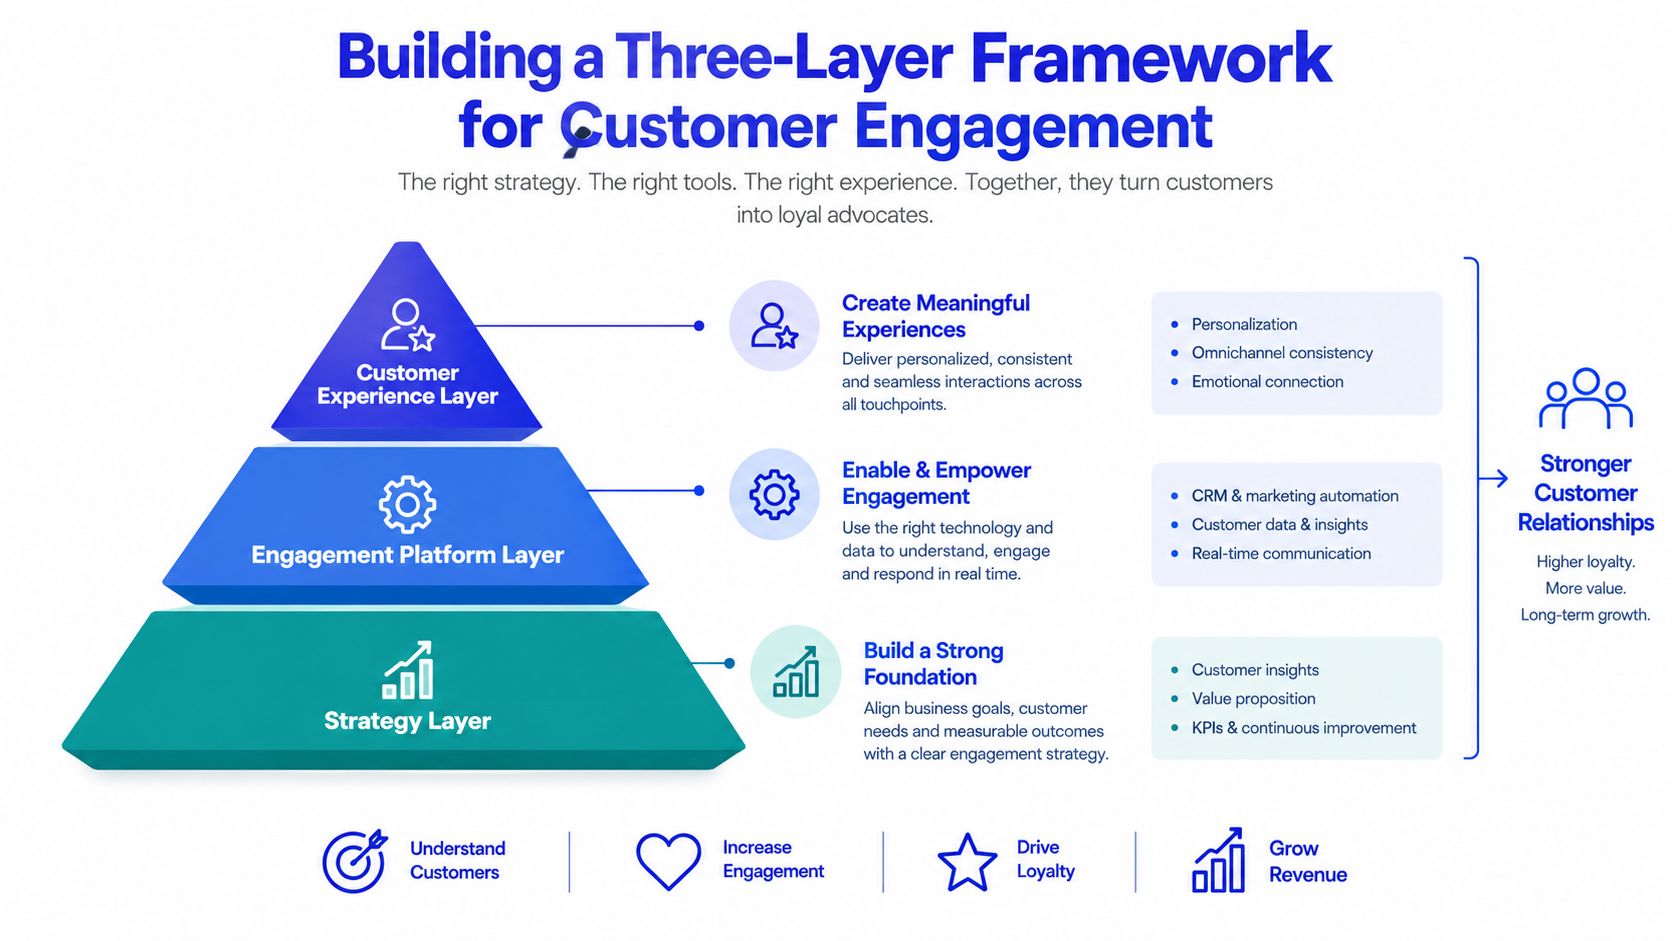
Building a Three-Layer Framework for Customer Engagement
A practical framework separates engagement into behavioral signals, sentiment indicators, and progression metrics. Each layer answers a different question:
Behavioral: What did the customer do?
Sentiment: How did the customer experience it?
Progression: Did the customer move closer to a valuable outcome?
Treating these layers independently creates the same silo problem in a new form. The value comes from reading them together. A customer who adopts a key feature, reports low effort, and advances to the next buying stage is more meaningful than one who generates repeated low-intent clicks.
Layer one captures observable behavior
The behavioral layer is the foundation because it records interaction without asking customers to explain themselves. Track product usage, feature adoption, content consumption, session frequency, repeat visits, and activity by channel. In a SaaS product, that might mean distinguishing a login from completion of the workflow that produces customer value. On a website, it might mean separating a page view from a visit that reaches pricing, documentation, or a contact action.
Segment these signals by acquisition source, customer cohort, account size, lifecycle stage, and use case. A temporary traffic spike shouldn't be treated as adoption until the same cohort returns and completes meaningful actions.
Layer two adds customer perspective
Behavior alone can't tell you whether a long session represents interest or frustration. Sentiment indicators such as CSAT, NPS, ticket trends, and qualitative conversation themes provide the missing interpretation. A drop in satisfaction after a feature release is more actionable when paired with lower adoption or a rise in support contacts about the same workflow.
Use surveys at meaningful moments, such as after resolution, onboarding completion, or a major product interaction. Avoid asking for feedback after every minor event. Survey fatigue reduces participation and leaves teams with a biased view of the experience.
Layer three measures movement
Progression metrics turn engagement into a forward-looking operating system. Track stage velocity, time-to-next-action, activation milestones, opportunity advancement, and the time between meaningful events. These measures show whether customers are moving through a journey or merely generating activity inside it.
A useful record might connect first visit, return visit, product trial, support interaction, feature adoption, qualified opportunity, and renewal. That sequence lets teams identify the point where momentum slows. It also creates a shared language for marketing, sales, product, and customer success.
The strongest signal isn't maximum activity. It's sustained activity that improves sentiment and moves the customer toward value.
Core Behavioral and Sentiment Metrics You Must Track
The core stack should be small enough to operate and rich enough to explain friction. Start with metrics that reveal frequency, depth, adoption, satisfaction, and loyalty, then add context through cohorts. A single aggregate number can hide the difference between a new user exploring the product and an established customer whose usage is collapsing.
Choose behavior that reflects value
DAU and MAU are useful only after you define what “active” means. A login may be sufficient for a communication tool, but it may be a weak signal for an analytics platform where the valuable action is creating a report or sharing an insight. Comparing daily activity with monthly activity can reveal usage frequency, but the ratio is meaningful only when the underlying event represents real product value.
Average session duration and pages per session should also be interpreted by context. Longer time can indicate deeper research on a product page, but it can signal confusion on checkout or support content. Repeat purchase rate is stronger when segmented by product category, acquisition channel, and customer cohort, because repeat behavior can show genuine loyalty rather than one-off promotional demand.
Metric | Calculation method | Business signal |
|---|---|---|
Active users | Count users who complete a defined meaningful action during the selected period | Reach and recurring product usage |
DAU to MAU relationship | Compare daily active users with monthly active users using consistent activity definitions | Usage frequency and product stickiness |
Average session duration | Total session time divided by total sessions | Depth of interaction, interpreted with conversion and friction signals |
Pages per session | Total page views divided by total sessions | Navigation depth and content interest |
Feature adoption rate | Users who use a feature at least once divided by the relevant customer population | Whether a feature is reaching its intended audience |
Repeat purchase rate | Returning purchasers divided by the defined purchasing population | Repeat demand and potential loyalty |
CSAT | Positive satisfaction responses divided by total responses, using a consistent survey scale | Experience quality after a defined interaction |
NPS | Percentage of promoters minus percentage of detractors | Advocacy and relationship sentiment |
Churn rate | Customers who stop using the service during a defined period divided by the chosen customer base | Loss of engagement and retention risk |
Make sentiment diagnostic, not decorative
NPS is useful for relationship-level loyalty, while CSAT works better immediately after a specific interaction. Don't use either as a substitute for behavioral evidence. A customer can report satisfaction with a support answer and still fail to adopt the product if the underlying workflow remains difficult.
Trigger surveys around events you can act on. Ask for CSAT after a resolved ticket, a completed onboarding step, or a support conversation. Review NPS alongside feature usage, repeat visits, ticket trends, and retention by cohort. The combination helps distinguish a genuine experience problem from a temporary reaction.
Ticket volume deserves the same caution. A lower volume can mean fewer problems, but it can also mean customers have stopped asking for help. Pair it with resolution quality, repeat contacts, abandonment, and subsequent usage. A customer service analytics framework can help teams connect support activity with customer outcomes instead of treating ticket counts as engagement by themselves.
Channel-Specific and AI-Assisted Engagement Indicators
Legacy channel metrics still have a place, but they shouldn't carry the whole measurement burden. Email provides a clear funnel from delivery to attention to action. Recent industry benchmarks cite an average marketing email open rate of 35.6% and a click-through rate of about 2.6% (MoEngage customer engagement benchmarks). Those figures are useful for comparison, but the click is closer to intent than the open, and neither proves revenue impact.
Interactive content has also been reported to generate about 52.6% more engagement than static content in the same benchmark source. Treat that as a format signal, not a universal forecast. The right question is whether participation improves the next action, such as product exploration, qualification, or conversion.
Measure responsiveness and channel fit
Customers increasingly expect businesses to respond across the channels they use. Research cited by Sinch reports that 36% of consumers want informational messages on more than one channel, 58% want to choose their preferred opt-in channel, and 87% expect fraud alerts instantly or within five minutes (Sinch's customer engagement research).
Build a channel scorecard that includes:
Preference fulfillment: Whether the business contacted the customer through the selected channel.
Reply speed: Time from customer message to first meaningful response.
Resolution continuity: Whether context carries across channels without forcing repetition.
Action rate: Whether the interaction produces the intended next step.
Abandonment: Where customers stop during a conversation or workflow.
Add AI quality measures
AI-assisted support needs indicators that describe trust and usefulness, not just bot volume. Track automated reply speed, answer acceptance, repeat questions, escalation appropriateness, sentiment change after the interaction, and the proportion of conversations that reach a defined resolution.
More than half of consumers, 52%, say they trust AI-generated answers for routine updates, according to the Sinch source above. That doesn't mean every automated answer deserves confidence. Separate routine requests from high-risk or ambiguous cases, then measure whether the agent escalates with enough context for a human to help quickly.
A strong AI scorecard therefore combines speed with quality. A fast answer that creates a second conversation is not an engagement win. A slower handoff with accurate intent, customer history, and a concise summary may produce better retention.
How to Calculate and Normalize Your Engagement Data
Raw counts reward the largest audience, not the most effective experience. A campaign with more impressions will often collect more clicks than a smaller campaign, even when its message performs worse for each person exposed. Normalization makes performance comparable across campaigns, channels, and customer segments.
The basic rule is simple: divide interactions by the relevant exposure base. Academic and industry definitions commonly calculate digital engagement as interactions divided by impressions, reach, or audience size (the academic review of social media engagement measurement).
Use the denominator that matches the question
Choose the denominator based on what you're trying to learn:
Engagement rate by impressions: Total interactions divided by impressions. This evaluates efficiency against total exposure.
Engagement rate by reach: Unique interactions divided by unique people reached. This reduces distortion from repeated exposure.
Click-through rate: Clicks divided by delivered messages, opens, or views, depending on the channel definition you use.
Feature adoption: Users who complete the feature action divided by the eligible user population.
Support resolution rate: Resolved interactions divided by total eligible support interactions.
Progression rate: Customers who complete the next milestone divided by customers who reached the prior milestone.
Document every denominator in your analytics dictionary. “Engagement rate” is ambiguous if one team uses impressions and another uses active users. Consistent definitions matter more than a visually impressive dashboard.
Normalize before comparing
Normalize by cohort when customer populations differ. Compare new accounts with new accounts, self-serve customers with self-serve customers, and similar campaigns with similar campaigns. Also separate exposure from outcome. High impressions with weak proportional clicks or follows indicates low engagement efficiency, even if top-line traffic looks strong.
The same discipline applies to support and AI. Measure resolved conversations per eligible request, meaningful actions per conversation, and repeat contact after resolution. Avoid dividing by total message volume when a conversation-level denominator better represents customer experience.
A bigger numerator doesn't prove better performance. First ask whether the denominator changed.
Tying Engagement Metrics to Business Outcomes and Revenue
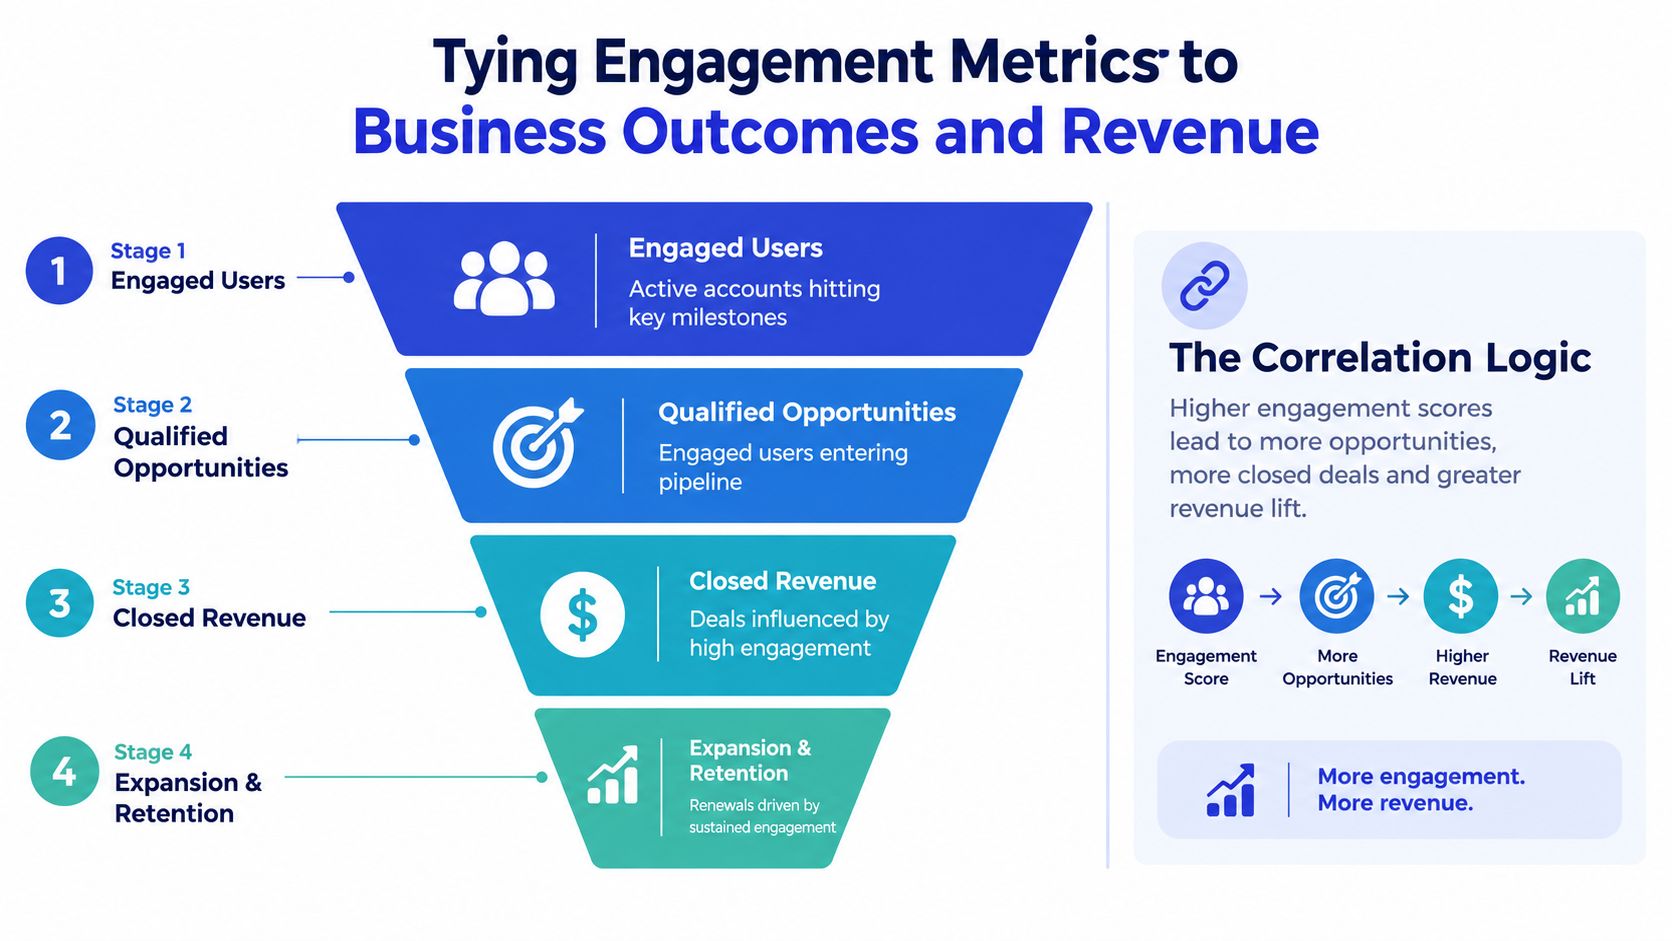
Revenue alignment starts by linking leading indicators to a defined commercial event. Feature adoption, meaningful sessions, support resolution, and cross-channel activity should sit upstream of conversion, renewal, expansion, or churn. If the events aren't connected at the customer or account level, attribution becomes storytelling.
In B2B and SaaS funnels, engagement depth and cross-channel activity can be more predictive of revenue than raw activity counts. Apollo notes that multi-channel engagement can correlate with 2 to 3 times higher conversion rates, while stakeholder diversity and stage velocity can reveal deal momentum and churn risk (Apollo's customer engagement metrics analysis). Correlation isn't proof of causation, so use these signals to prioritize investigation, not to claim that every interaction caused a deal.
Build a traceable path to value
Create an account-level event chain:
Engaged user: The customer completes a meaningful action, not merely a page view.
Qualified opportunity: Engagement coincides with an intent signal and meets your qualification criteria.
Closed revenue: The opportunity converts, with influence recorded rather than assumed.
Expansion or retention: Sustained usage, positive sentiment, and successful outcomes precede renewal or growth.
For each stage, define the next action and the owner. Marketing may own qualified engagement, sales may own stage velocity, product may own activation, and customer success may own renewal risk. The shared account record is what makes the model useful.
Teams also need a consistent view of account condition. A practical account health score guide can help structure the inputs, but don't let a health score become another opaque composite. Show the underlying behavior, sentiment, progression, and outcome signals so an account manager can act.
Test influence without overclaiming
Compare cohorts that receive different experiences, review engagement before and after interventions, and monitor conversion and retention alongside the leading signals. A support interaction that ends in resolution may protect an expansion opportunity, but only account-level follow-up can show whether the customer continued using the product.
The metric stack should answer three operational questions: What changed? Which customers are affected? What action should the team take next? If it can't answer those questions, it remains reporting rather than revenue intelligence.
Improving Engagement Scores with AI Support Agents
Measurement creates value only when teams use it to change the experience. An AI support agent can improve the behavioral and sentiment layers when it answers relevant questions quickly, guides visitors toward a useful next step, and escalates cases that require human judgment.
For an SMB or SaaS team, the implementation should begin with a narrow, high-intent surface. Train the agent on current website content, pricing, product pages, and FAQs. Deploy it on pages where visitors already need clarification, then define the actions that matter, such as completing qualification, booking a conversation, finding documentation, or reaching the right support queue.
Turn conversations into measurable journeys
Chatgrow can create and deploy custom support agents, use Smart Intent to classify what visitors need, qualify leads, and use smart escalation when a human must take over. The useful measurement isn't the number of chats started. Track answer acceptance, conversation completion, repeat questions, escalation quality, time to first response, post-interaction sentiment, and the next customer action.
For teams evaluating AI in service operations, Truespeak's guide to AI for trade service teams offers useful context on matching automation to real support workflows. The same principle applies elsewhere: automate routine information requests, preserve human ownership for nuanced or sensitive cases, and review failures as training inputs.
A monitoring process should inspect unresolved intents, outdated answers, unnecessary escalations, and conversations that end without a clear next step. The AI agent monitoring guide provides a practical reference for building that feedback loop.
The video below adds a visual view of how AI-assisted conversations can fit into customer service operations.
Don't optimize the agent for maximum automation. Optimize it for accurate intent, useful resolution, appropriate escalation, and measurable progression. Review those outcomes by page, customer segment, and issue type, then retrain the system when the data shows repeated friction.
Chatgrow lets businesses create, train, and deploy custom AI support agents for instant answers, lead qualification, and structured escalation across high-intent pages. Use the resulting conversation, sentiment, and progression signals to strengthen your customer engagement metrics, then visit Chatgrow to explore a practical setup for your team.
More articles from the chatgrow Team